Cart 0

[vc_row][vc_column][vc_toggle title=”Explanation/ Important formulas:” el_id=”1481454282462-60885454-0285″]
- Venn Diagrams as an alternate way of depicting sets. Venn Diagrams consist of closed shapes, generally circles, which represent sets. The capital letter outside the circle denotes the name of the set while the letters inside the circle denote the elements of the set.
- The various operations of sets are represented by partial or complete overlap of these closed figures. Regions of overlap represent elements that are shared by sets.
- In practice, sets are generally represented by circles. The universal set is represented by a rectangle that encloses all other sets. Venn Diagrams are generally not drawn to scale
[/vc_toggle][vc_toggle title=”Instructions to take Aptitude Test” el_id=”1481454372988-cd8f0f96-30f0″]
Click on start to start taking the test.
Click on the option (A, B, C or D) to figure out the right answer.
You can answer multiple times till you get the right answer.
Once you get the right answer, explanations (if any) for the same will be showcased down.
On click of list, you get to see total no of questions, no of questions you answered and no of questions pending to answer.
On click of question number you will go to that particular question.
On click of END your test will end.
On click of ‘Get Results’ you will get to see correct answer for each questions.
[/vc_toggle][vc_toggle title=”Venn Diagrams – Test” el_id=”1481454458410-9a4a39ac-c8b7″]
Venn Diagrams - Question and Answers
Congratulations - you have completed Venn Diagrams - Question and Answers.
You scored %%SCORE%% out of %%TOTAL%%.
Your performance has been rated as %%RATING%%
Your answers are highlighted below.
Question 1 |
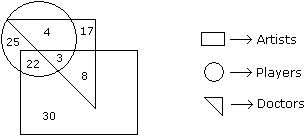
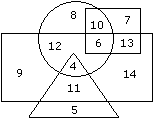
Study the following figure and answer the question "How many doctors are neither artists nor players" ?
17 | |
5 | |
10 | |
30 |
Question 1 Explanation:
The number of doctors who are neither artists nor players is 17.
Question 2 |
Study the following figure and answer the question "How many doctors are both players and artists" ?
22 | |
8 | |
3 | |
30 |
Question 2 Explanation:
The number of doctors who are both players and artists is 3.
Question 3 |
Study the following figure and answer the question "How many artists are players" ?

5 | |
8 | |
25 | |
16 |
Question 3 Explanation:
The number of artists who are players is 22 + 3 = 25.
Question 4 |
Study the following figure and answer the question "How many players are neither artists nor doctors" ?
25 | |
17 | |
5 | |
10 |
Question 4 Explanation:
The number of players who are neither artists nor doctors is 25.
Question 5 |
Study the following figure and answer the question "How many artists are neither players nor doctors" ?
10 | |
17 | |
30 | |
15 |
Question 5 Explanation:
The number of artists who are neither players nor doctors is 30.
Question 6 |
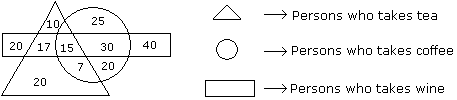
Study the diagram given below and answer "How many persons who take tea and wine but not coffee" ?
20 | |
17 | |
25 | |
15 |
Question 6 Explanation:
17 persons take tea and wine but not coffee.
Question 7 |
Study the diagram given below and answer "How many persons are there who take both tea and coffee but not wine" ?
22 | |
17 | |
7 | |
20 |
Question 7 Explanation:
Number of persons was taken both tea and coffee but not wine is 7.
Question 8 |
Study the diagram given below and answer "How many persons take wine" ?
100 | |
82 | |
92 | |
122 |
Question 8 Explanation:
122 persons take wine.
Question 9 |
Study the diagram given below and answer "How many persons are there who takes only coffee" ?
90 | |
45 | |
25 | |
20 |
Question 9 Explanation:
25 + 20 = 45
Question 10 |
Study the diagram given below and answer "How many persons takes all the three" ?
20 | |
17 | |
25 | |
15 |
Question 10 Explanation:
15 persons take all the three.
Question 11 |
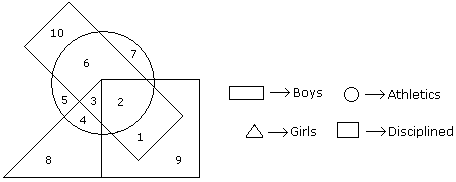
In the following diagram the boys who are athletic and are disciplined are indicated by which number?
1 | |
2 | |
10 | |
6 |
Question 11 Explanation:
The required number is 2.
Question 12 |
In an organization of pollution control board, engineers are represented by a circle, legal experts by a square and environmentalist by a triangle. Who is most represented in the board as shown in the following figure ?

Environmentalists | |
Legal Experts | |
Engineers with legal background | |
Environmentalists with Engineering background |
Question 12 Explanation:
Environmentalists with Engineering background is most represented in the board.
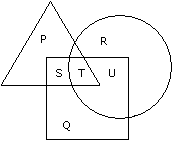
Question 13 |
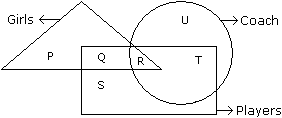
In the following figure triangle represents 'girls', square players and circle-coach. Which part of the diagram represents the girls who are player but not coach?
P | |
Q | |
R | |
S |
Question 13 Explanation:
Q part of the figure represents those girls who are players but not coach.
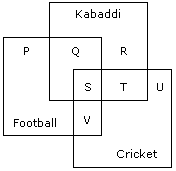
Question 14 |
The diagram given below represents those students who play Cricket, Football and Kabaddi. Study the diagram and identify the students who play all the three games.?
P + Q + R | |
V + T | |
S + T + V
| |
S |
Question 14 Explanation:
S indicates those students who play all three games.
Question 15 |
In the figure given below, square represents doctors, triangle represents ladies and circle represents surgeon. By which letter the ladies who doctor and surgeon both are represented ?
U | |
T | |
S | |
P |
Question 15 Explanation:
The letter ladies who doctor and surgeon both are represented is T
Question 16 |
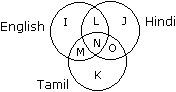
Study the diagram and identify the people who can speak only one language ?
L + M + O | |
K + J + I | |
K | |
I |
Question 16 Explanation:
The regions represented by the letters K, J and I denote such people who can speak only one language.
Question 17 |
In the given figure if Triangle represents healthy people, Square represents old persons and Circle represents men then What is the number of those men who are healthy but not old ?

3 | |
4 | |
6 | |
2 |
Question 17 Explanation:
The number of those men who are healthy but not old is 2
Question 18 |
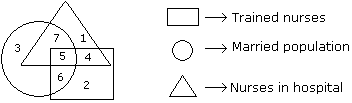
If hospital management requires only married trained nurses for operation theater, which part of diagram should be chosen by him ?
7 | |
4 | |
5 | |
6 |
Question 18 Explanation:
The part of diagram should be chosen by him is 5
Question 19 |
By which number, married but untrained nurses in the hospital are represented ?
4 | |
6 | |
7 | |
5 |
Question 19 Explanation:
Married but untrained nurses in the hospital are represented by 7
Question 20 |
By which numbers trained nurses are represented ?
3, 6 | |
7, 5 | |
5, 6 | |
1, 5 |
Question 20 Explanation:
Trained nurses are represented by number 5, 6
Question 21 |
What is represented by the number 7 ?
Married nurses in the hospital | |
Trained nurses | |
Unmarried trained nurses | |
Married trained nurses |
Question 21 Explanation:
Number 7 represents Married nurses in the hospital
Question 22 |
By which number, the trained unmarried nurses in the hospital are represented ?
6 | |
5 | |
7 | |
4 |
Question 22 Explanation:
The trained unmarried nurses in the hospital are in the number represented by 4.
Question 23 |
In the following diagram rectangle represents men, Triangle represents educated, Circle represents urban and square represents government employees "Which one of the following represents the educated men but not urban" ?
9 | |
5 | |
4 | |
11 |
Question 23 Explanation:
The number 11 represents the educated men but not urban.
Question 24 |
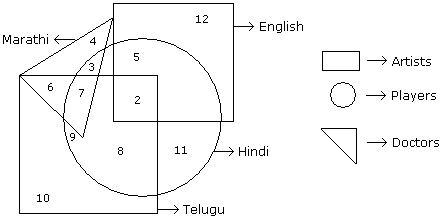
In the following figure small square represents the persons who know English, triangle to those who know Marathi, big square to those who know Telugu and circle to those who know Hindi. In the different regions of the figures from 1 to 12 are given.
"How many persons can speak English and Hindi both the languages only" ?
5 | |
8 | |
7 | |
18 |
Question 24 Explanation:
Number of persons who can speak English and Hindi both only is 5.
Question 25 |
In the following figure small square represents the persons who know English, triangle to those who know Marathi, big square to those who know Telugu and circle to those who know Hindi. In the different regions of the figures from 1 to 12 are given.
"How many persons can speak Marathi and Telugu both" ?
10 | |
11 | |
13 | |
None of these
|
Question 25 Explanation:
6 + 7 = 13.
Question 26 |
In the following figure small square represents the persons who know English, triangle to those who know Marathi, big square to those who know Telugu and circle to those who know Hindi. In the different regions of the figures from 1 to 12 are given.
"How many persons can speak only English" ?
9 | |
12 | |
7 | |
19 |
Question 26 Explanation:
Number of persons were can speak English is 12.
Question 27 |
In the following figure small square represents the persons who know English, triangle to those who know Marathi, big square to those who know Telugu and circle to those who know Hindi. In the different regions of the figures from 1 to 12 are given.
"How many persons can speak English, Hindi and Telugu" ?
8 | |
2 | |
7 | |
None of these |
Question 27 Explanation:
Number of persons who can speak English, Hindi and Telugu is 2.
Question 28 |
In the following figure small square represents the persons who know English, triangle to those who know Marathi, big square to those who know Telugu and circle to those who know Hindi. In the different regions of the figures from 1 to 12 are given.
"How many persons can speak all the languages" ?
1 | |
8 | |
2 | |
None |
Question 28 Explanation:
There is no such person who can speak all the languages.
Once you are finished, click the button below. Any items you have not completed will be marked incorrect.
There are 28 questions to complete.
[/vc_toggle][vc_empty_space][vc_btn title=”More Aptitude Question” color=”warning” size=”lg” align=”center” link=”url:https%3A%2F%2Fjumpwhere.com%2Faptitude%2F||” button_block=”true”]